The Ads in This Month's Podcasts: 10,881 Episodes, Measured
See how it works See pricing, first 5 episodes free

ZeroAds does one job: you give it a podcast’s RSS feed, it cuts the ads out of the audio, and it hands back a clean private feed for the app you already use. Every cut is logged with timestamps and a confidence score, per episode, per show.
This is that log for the last three weeks: every episode we processed from July 16 to August 5, 2026. Not a survey, not a model of the market. Edits to audio files, added up. And because a measurement is only as good as the measurer, the methodology states how accurate the detector itself is, measured against hand-labeled episodes.
The headline numbers
Section titled “The headline numbers”- 10,881 episodes across 1,112 shows
- 900 hours of ads removed in three weeks
- Median: 4.2 minutes of ads per episode, average 5.0
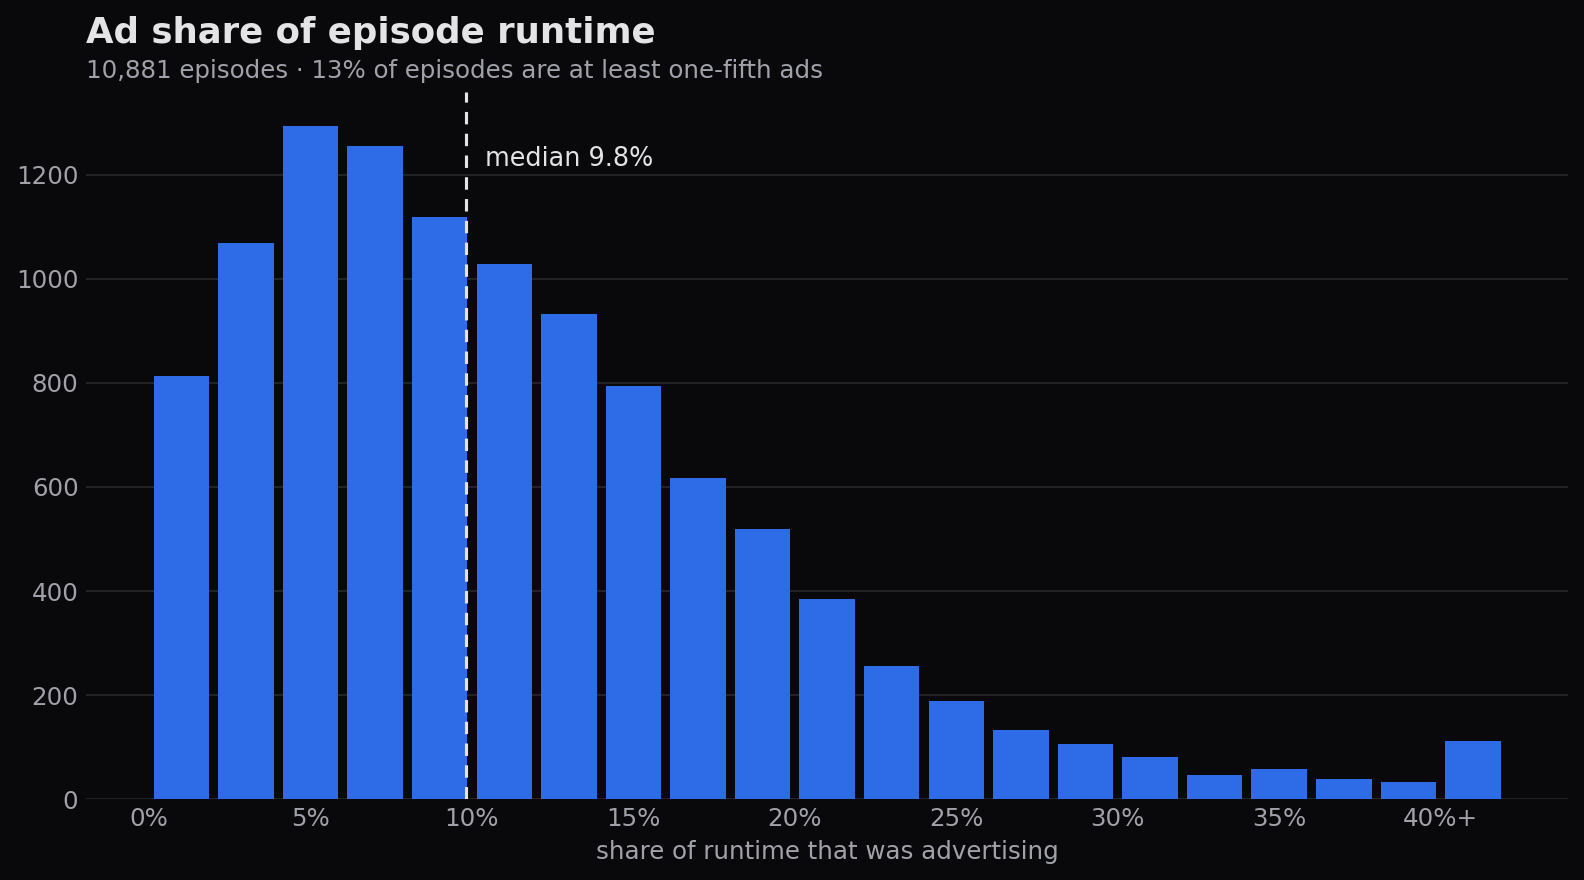
- Median ad share: 9.8% of runtime. The typical episode gives one minute in ten to advertising.
Most episodes are mild. One in eight is not.
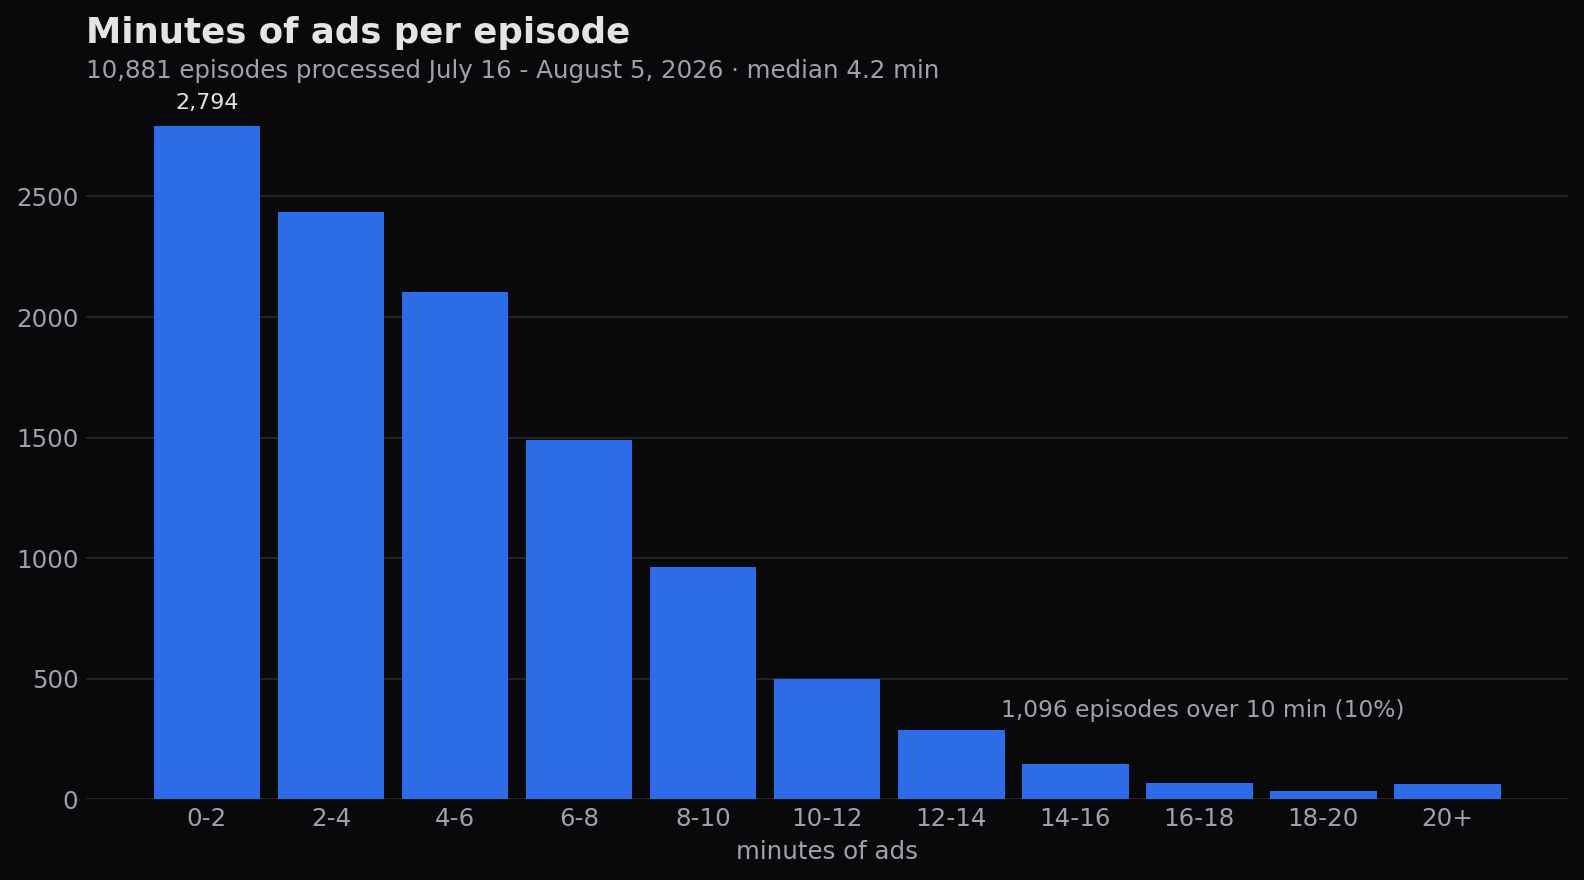
Section titled “Most episodes are mild. One in eight is not.”The distribution leans low: 26% of episodes carried under two minutes of ads. If that were the whole picture, podcast ads would be a shrug.
The other end of the curve is the reason this company exists. 10% of episodes carried more than ten minutes of ads. 13% of episodes were at least one-fifth advertising. Each of those is a specific episode of a specific show someone chose on purpose.
What the median costs a listener
Section titled “What the median costs a listener”Take the median, 4.2 minutes, and a listener who gets through eight episodes a week. That’s about 34 minutes of ads a week, roughly 29 hours a year, inside shows they picked themselves. Follow shows from the top of the next table and the number multiplies.
The shows that carry the most
Section titled “The shows that carry the most”One rule, applied mechanically: any show with at least 20 measured episodes in the window qualifies, ranked by median ad share of runtime. No editorial picks in either direction.
| Show | Median ad share | Median ad minutes | Episodes measured |
|---|---|---|---|
| The Dr. Laura Podcast | 37.7% | 5.7 | 42 |
| Marketplace Morning Report | 30.5% | 2.8 | 28 |
| History Daily | 28.2% | 7.3 | 179 |
| The Breakfast Club | 26.0% | 9.8 | 65 |
| Ridiculous History | 24.4% | 13.2 | 22 |
| Writing Excuses | 21.8% | 4.9 | 73 |
| Jill on Money | 21.2% | 4.3 | 81 |
| What Next (Slate) | 21.2% | 7.1 | 116 |
| HugoDécrypte | 20.5% | 2.0 | 27 |
| Legal AF | 20.2% | 4.6 | 24 |
| Morning Wire | 20.2% | 3.5 | 31 |
| Pod Meets World | 19.9% | 12.3 | 24 |
Two patterns. The top of the table is short daily shows built from radio formats: a 10-minute episode with a stacked opening break and a closing read is a third ads by arithmetic, even when the total is only three minutes. And the percentage hides the minutes: Ridiculous History and Pod Meets World carry 12 to 13 minutes of ads per episode, more total ad time than anything above them, spread across hour-long runtimes.
About the people making the shows
Section titled “About the people making the shows”Ads are how most of these shows get made; the minutes in that table pay salaries. This is a measurement, not an accusation. On our side, we’re building revenue sharing so the shows our subscribers listen to most get paid from subscription money. Until that ships, the plain description of ZeroAds is that we work for the listener.
Hear the difference on your own shows
Section titled “Hear the difference on your own shows”ZeroAds serves your shows as clean private feeds that work in any podcast app that accepts a custom RSS URL (not Spotify, which doesn’t). Setup is pasting one link, about two minutes. The first 5 episodes are free, so you can hear a cleaned episode before paying anything. The founding rate is $5.99 a month while the first 500 spots last (more than 180 are claimed); after that it’s $7.99.
Methodology
Section titled “Methodology”Every episode processed by ZeroAds between July 16, 2026, 23:00 UTC and August 5, 2026. Read this before citing the numbers.
ZeroAds sells ad removal, so every number here comes from a company with something to gain. Read it that way. This section includes the parts that cut against us.
Where the numbers come from
Section titled “Where the numbers come from”When a show releases an episode, our pipeline downloads the audio, transcribes it, and makes two passes over the transcript to mark ad segments. Marked segments are cut from the audio; every cut is logged with start and end timestamps and a confidence score. This study is that log, aggregated: 10,881 episodes across 1,112 shows, 900 hours of ad time removed. What counts as an ad: advertising inserted by an ad server, and sponsor reads recorded by the show itself. Both get cut, both get counted.
How accurate the detector is, measured
Section titled “How accurate the detector is, measured”We test the detector against episodes that people labeled by hand, listening to the audio, chosen independently of what the system cut. Run through the full production system:
- Of the labeled ad time, we catch about 97-98%. Ads we miss are absent from these totals, which pushes the numbers down.
- Of the seconds we cut, about 85% land on labeled ad time. Most of the remainder sits on the boundaries of those same ads, where the exact start and end of an ad is genuinely fuzzy; cuts of non-ad content push the numbers up.
The two errors pull in opposite directions and neither is zero, so treat every figure as carrying a few percent of measurement error, not as exact. The test set covers short news shows, long talk shows, and one non-English show; detection on non-English shows is measurably weaker, so treat those shows’ figures as carrying more error.
The sample, and what’s wrong with it
Section titled “The sample, and what’s wrong with it”The sample is every episode processed in the window: the new releases of the shows our users subscribe to. Users pick the shows, so it skews toward what they listen to: talk-heavy, US-centric, and toward daily shows, which release more episodes per week than weeklies and therefore weigh more in per-episode statistics. People also come to us for the shows that annoy them, which overweights heavy shows. Treat every number as a description of our catalog’s current releases, not of podcasting overall. For the market-wide picture, industry benchmarks (Magellan AI among them) put average ad load around 5 to 8 percent of runtime; nothing here contradicts that.
Two coverage gaps during the window, both fixed by August 4: a refresh bug caused some high-frequency feeds to skip episodes, and a safety guard held back some short episodes rather than risk over-cutting them. Both reduce how many episodes appear here; neither changes the measurements of the episodes that do.
Dynamic insertion
Section titled “Dynamic insertion”Most podcast ads are stitched into the file at download time, per request. Two listeners downloading the same episode can get different ads in different amounts. Our figures describe the copies our pipeline downloaded, at the moments it downloaded them. The distribution is stable across thousands of episodes; any single data point is one copy’s snapshot.
Episode length
Section titled “Episode length”Ad share is computed against the actual length of the audio file we measured, not the length the feed declares; feeds mis-state durations often enough that using them would inflate some shows’ percentages.
Rules for the per-show table
Section titled “Rules for the per-show table”A show appears when we measured 20 or more of its episodes in the window. That is the entire inclusion test; no show was added or removed editorially. Duplicate feeds of the same show were merged. Ranking is by median, not average, so a single unusual episode can’t move a show up the table.
What this data can’t say
Section titled “What this data can’t say”It says nothing about shows nobody has added to ZeroAds. It can’t tell you which ad server placed a given ad beyond what’s audible in the file. We didn’t measure listening behavior, only episode contents. And a three-week window says nothing about trends; industry ad revenue grows around 18 percent a year (IAB/PwC) while per-episode load stays roughly flat, and nothing here contradicts that either.
Checking the work
Section titled “Checking the work”If you’re covering this and want the aggregation queries, the bucket boundaries, or the measurements behind any show in the table, ask and we’ll share them. If you find an episode where our numbers look wrong, send it over. We’ll check it against the audio, and if we got it wrong we’ll say so in public.
The charts and the table are free to reuse with a link to this page as the source. The table is also a CSV download.