Withdrawn: We Measured the Ads in 60,000 Podcast Episodes

ZeroAds does one job: you give it a podcast’s RSS feed, it cuts the ads out of the audio, and it hands back a clean private feed for the app you already use. Doing that job sixty thousand times leaves a record. Every ad we cut is logged with timestamps, per episode, per show.
That record is now big enough to be worth publishing. We pulled the numbers on July 8, 2026. Here’s what podcast ads look like from inside the audio.
The headline numbers (withdrawn)
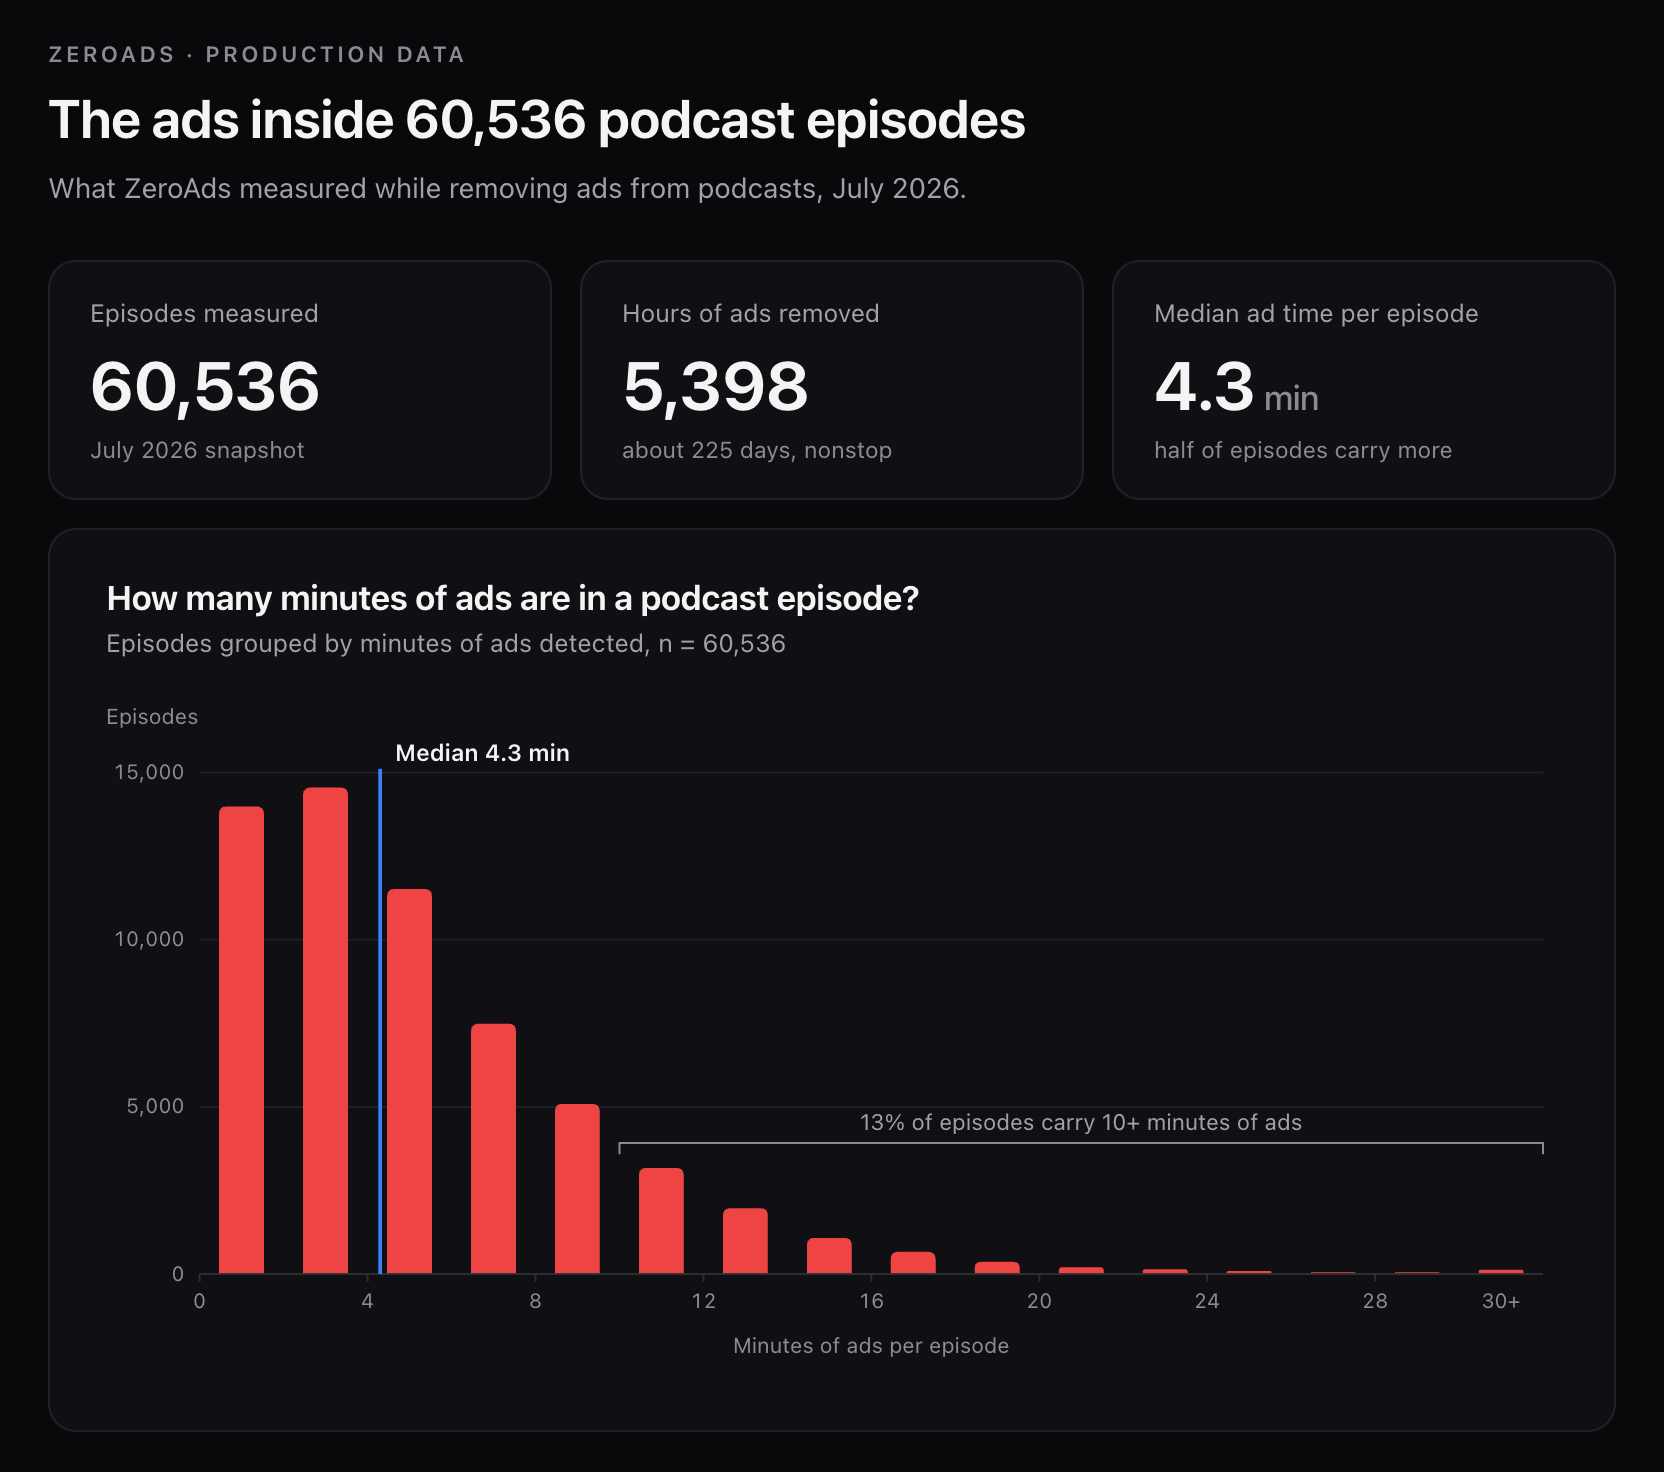
Section titled “The headline numbers (withdrawn)”- 60,536 episodes with ads removed
- 5,398 hours of ads cut. Played back to back, that’s about 225 days of nonstop advertising.
- Median: 4.3 minutes of ads per episode.
- Average: 5.4 minutes. The gap between those last two numbers is the story.
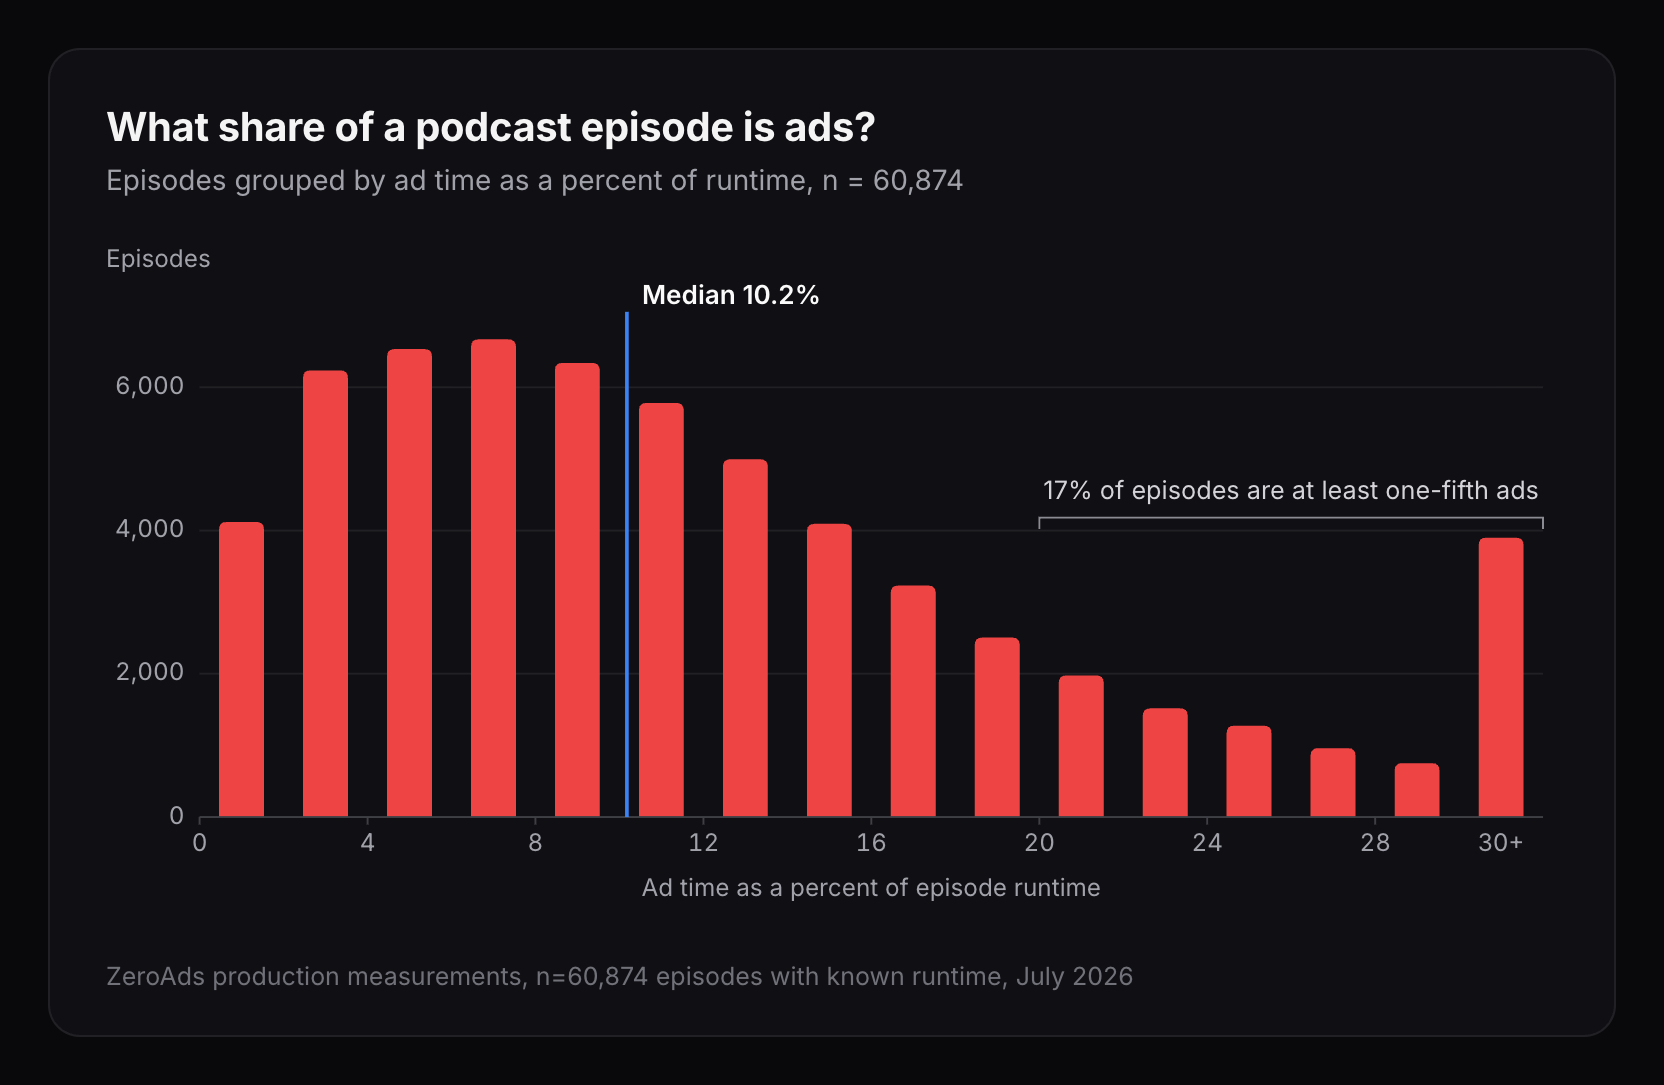
People asked to see this as a share of runtime instead of minutes, so here it is (measured again this week, n = 60,874): the median episode is 10.2% ads.
Most episodes are mild. The tail is not.
Section titled “Most episodes are mild. The tail is not.”The distribution leans low. 13,987 episodes (23%) carried under two minutes of ads, and the most common load was two to four minutes. If that were the whole picture, podcast ads would be a shrug.
The tail is the rest of the picture. 7,897 episodes, 13% of everything we processed, carried more than ten minutes of ads. 639 episodes carried more than twenty minutes. 126 carried over half an hour of ads in a single episode. Each of those is a specific episode of a specific show, and if your subscriptions lean the wrong way, that tail is your commute.
What the median costs a listener
Section titled “What the median costs a listener”Take the median, 4.3 minutes, and a listener who gets through eight episodes a week. That’s about 34 minutes of ads a week, close to 30 hours a year, inside shows they chose on purpose. Follow heavier shows and the number climbs fast. Which brings us to the table.
The shows that carry the most (removed)
Section titled “The shows that carry the most (removed)”This section contained a table ranking 16 shows by measured ad load. We have removed it, and it should not be reproduced from cached copies.
The table was the least defensible thing in the study. Ranking shows by the ad load our own detector measured means the ranking preferentially surfaces the shows the detector fails on: a show reaches the top either because it genuinely carries a lot of ads or because we mis-cut it, and the table cannot tell those two cases apart. Independent figures from Podscribe for the shows we placed highest are roughly half of what we published.
The CSV download has been removed for the same reason.
The caveats, before you quote this
Section titled “The caveats, before you quote this”Don’t quote this. See the correction at the top.
For the record, the caveats we did publish were these: our data covers the shows our users chose to clean, which skews toward talk-heavy US shows, so this was a measurement of our catalog and not of podcasting overall. Industry benchmarks (Magellan AI among them) put average ad load around 5 to 8 percent of runtime. Podcast ads are inserted dynamically at download time, so these figures described the copies we processed at the moment we processed them.
The caveat we failed to publish is the one that mattered: we never measured how often the detector cuts something that isn’t an ad.
About the people making the shows
Section titled “About the people making the shows”Ads are how most of these shows get made; the minutes in that table pay salaries. So this data is a measurement, not an accusation. On our side, we’re building revenue sharing so the shows our subscribers listen to most get paid from subscription money. Until that ships, the plain description of ZeroAds is that we work for the listener.
Questions about the correction
Section titled “Questions about the correction”Is any of this still valid? Treat none of the ad-load figures as valid. The direction of the error is up: we cut things that were not ads and counted them as ads, so the real numbers are lower than what we published, by an amount we have not yet measured.
What exactly was the bug? The detector cuts a block from the start of an episode more often than it should, and cuts it too long. A pre-roll ad is typically 15 to 60 seconds. Across the data behind this study, 21% of our leading cuts ran over two minutes. On James Cridland’s episode it ran 130 seconds and removed the entire opening news segment.
Were paying customers affected? Yes. This is a product bug, not only a data-reporting one. If we removed part of a show you were listening to, that is the same bug, and fixing it is our first priority.
Which figure do you now believe? None of ours, until we re-measure. Where independent numbers exist, use those. Podscribe publishes podcast ad load and their figures for the shows we ranked highest are roughly half of ours.
When do you republish? When we can state a false-positive rate next to every number. Not before.
Methodology
Section titled “Methodology”How we measured the ads in 60,536 podcast episodes. Snapshot date: July 8, 2026.
ZeroAds sells ad removal, which means every number in the study comes from a company with something to gain. Read it that way. This page is the full method, including the parts that cut against us. For what it’s worth, the central finding (most episodes carry a modest two to four minutes of ads) is not the number a marketing department would have ordered.
Where the numbers come from
Section titled “Where the numbers come from”When a user adds a show, our pipeline downloads each episode, transcribes it, and runs a two-pass classifier over the transcript to mark ad segments. Marked segments are cut from the audio, and every cut is logged with start and end timestamps. The study is that log, aggregated: 60,536 episodes with at least one ad removed, 5,398 hours of ad time, as of July 8, 2026. We measure what we actually cut: edits to specific audio files, logged as they happen. No part of the study is a model’s estimate of a market.
What counts as an ad
Section titled “What counts as an ad”Whatever the classifier marks as advertising: ads inserted into the episode by an ad server, and sponsor segments recorded by the show itself. Both get cut, both get counted.
The sample, and what’s wrong with it
Section titled “The sample, and what’s wrong with it”The sample is every episode processed on our platform. Users pick the shows, so it skews toward what our users listen to: talk-heavy, US-centric programming. People also come to us for the shows that annoy them, which overweights heavy shows. That’s selection bias and we can’t correct for it, so treat every number here as a description of our catalog. For the market-wide picture, industry benchmarks (Magellan AI among them) put average ad load around 5 to 8 percent of runtime. Nothing in our data contradicts that.
Dynamic insertion
Section titled “Dynamic insertion”Most podcast ads are stitched into the file at download time, per request. Two listeners downloading the same episode can get different ads in different amounts. Our figures describe the copies our pipeline downloaded, at the moments it downloaded them. Download the same episode again today and the ad minutes can shift. The distribution is stable across 60,000 episodes; any single data point is one copy’s snapshot.
Why the totals undercount ← this section was wrong
Section titled “Why the totals undercount ← this section was wrong”This is the passage that broke the study, so it stays up, quoted exactly as published:
We only count an ad if we caught it. Detection is verified at 90%+, and in our accuracy tests (against hand-labeled episodes) the pipeline catches about 97% of ad segments. That’s a test result, not a guarantee, and it’s about what we remove, so anything that slips through appears in no log and no total. Every aggregate in the study is a floor. True ad time sits somewhat above what we report.
Every sentence there is about recall: how much of the advertising we manage to catch. The conclusion drawn from it (“every aggregate is a floor”) is a claim about precision: that we hardly ever cut anything that isn’t an ad. Recall does not imply precision. A detector can catch 97% of the ads and still cut minutes of the show along the way, and ours does.
We had no precision measurement at all. We did not have one when we published, and we did not notice we were missing one. The honest statement would have been that we did not know the direction of the error. Instead we asserted the direction that flattered us.
Rules for the per-show table (removed)
Section titled “Rules for the per-show table (removed)”The table is gone; see above. For the record, the inclusion rule was mechanical (20 or more measured episodes, no editorial exclusions), and that part was true. A mechanical rule applied to a biased measurement still produces a biased table.
Median versus average
Section titled “Median versus average”The median episode carries 4.3 minutes of ads; the average is 5.4. The average sits higher because the tail is heavy: 13% of episodes carry more than 10 minutes, and 126 episodes carried over half an hour. When one number has to stand for the dataset, we use the median.
What this data can’t say
Section titled “What this data can’t say”It says nothing about shows nobody has added to ZeroAds. It can’t tell you which ad server or network placed a given ad beyond what’s audible in the file. We didn’t measure listening behavior, only episode contents. And it isn’t evidence that podcast advertising is exploding: industry ad revenue grows around 18 percent a year (IAB/PwC), while per-episode ad load market-wide stays flat to slightly down. Our tail numbers show how uneven the load is. They say nothing about growth.
Checking the work
Section titled “Checking the work”This was the original offer, and it stays:
If you find an episode where our numbers look wrong, send it over. We’ll check it against the audio, and if we got it wrong we’ll say so in public.
Someone did, we did, and this page is us saying so. The offer is open. If you have an episode where our cut looks wrong, send it and we will check it against the audio.
The charts and the table have been withdrawn and should not be reused. The CSV download has been removed. If you have republished any figure from this study, please link to this correction.